tutorial · 2026-11-03
How to read an MPC trajectory plot
A short introduction to reference paths, predicted motion and constraints.
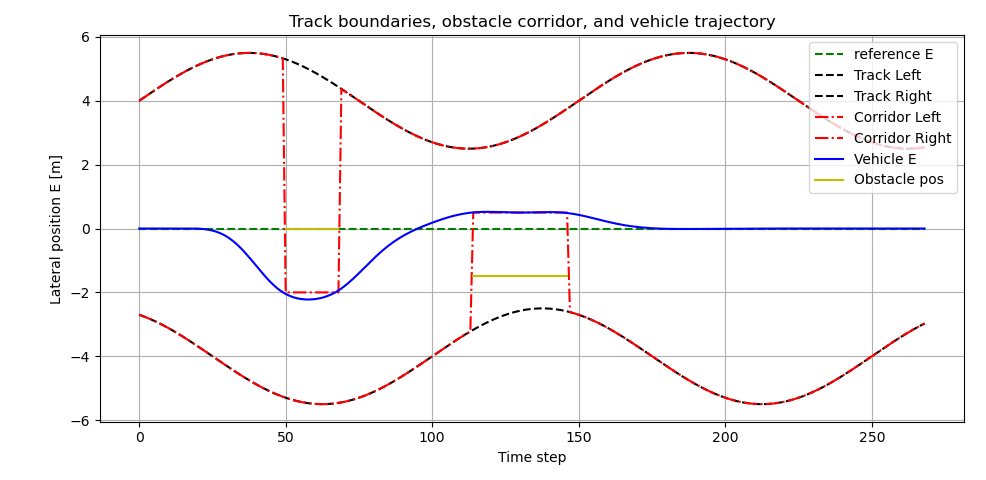
A trajectory plot connects a controller’s decisions to motion in space. Before comparing curves, check the axes, units, legend and the time interval shown.
1. Reference and actual motion
The reference describes the desired motion. A measured or simulated trajectory shows the response. A predicted trajectory is a forecast from one optimisation step; it is not the same as the subsequently executed path.
2. Constraints and control effort
Tracking error is only one criterion. Check whether the motion respects state and input constraints. Steering, acceleration and their rates can reveal demanding control actions even when the path looks accurate.
3. Reproducibility
A meaningful comparison states the model, horizon, sample time, constraints and test conditions. A visually close path alone does not establish safety or robustness.